
A little while ago, I published a survey, trying to gauge the levels of psychological safety in the workplace. Now that’s ran for a while, I’d like to share the results.
First of all, I want to say thank you to everyone who decided to share their experiences, there was both very positive, to very negative and everything in between. I realise thinking about this for some may have triggered some things you’d like to forget, so I’d also like to say thank you again for that.
The questions
Before we dig into any results, I asked simple questions first of all like which industry do you work in, which region you are in, and broadly, what type of role you hold. I’m basically using these questions to help see if we can form any patterns from the data.
Next, I asked some scenario based questions, which could be answered on a scale of 1-10, to provide answers in an NPS style, again to try and improve the quality of data.
Participants had to say if they strongly disagreed all the way to strongly agreed with specific statements about the likelihood of a positive outcome from discussing that scenario with their immediate manager.
I’ll post the questions below, when we talk about specific results.
The results
I wasn’t sure what to expect from running this survey, so I can’t say I had any pre-conceptions of the types of responses, or any potential correlation of data. So, here goes…
The survey had an astonishing response, with 2,272 responses.
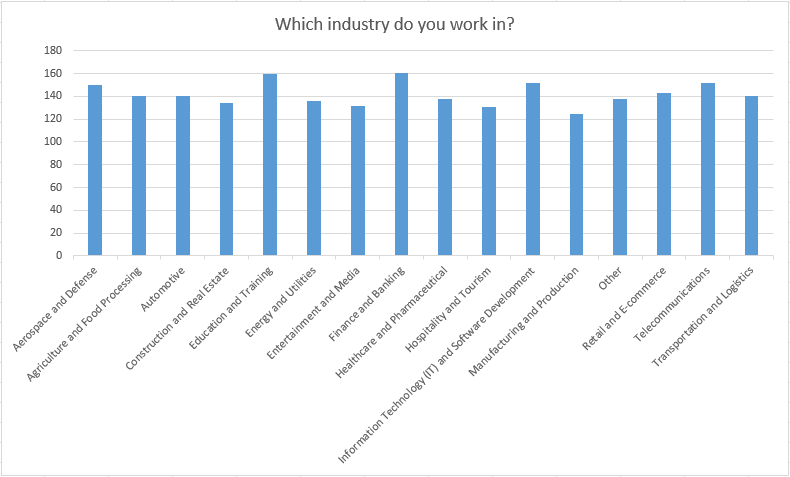
When we asked people what industry they worked in, we got a good spread over pretty much all areas. Finance and Banking were the top responders with 161, closely followed by Education and Training with 160.
Next, we asked people which region they worked in. Again, a fairly even spread, but Asia accounted for the most respondents with 412, a way ahead of the next.

Upon thinking about it, people will have answered this in different ways, either where they are based, or where the company are based, which of course with hybrid and remote working, could be different.
Finally, let’s look at the type of jobs which people perform. You can see quite a skew of over 100 respondents towards individual contributors.

Now for the NPS style questions, which I will show an NPS style result. For those who do not know the principle behind NPS. Basically, if you score a 9-10, then you are classes as a promoter, 7-8 a passive, and 0-6 a detractor. Your NPS score is on a scale of -100 to 100.
The first question I asked was; “You have had a personal situation and need to ask for a little time to sort it out so you can focus at work.”.
These results show that only 17% are classed as promoters, the majority are detractors at 65%, and 18% passives, this places our NPS at a score of -49.

The next question I asked was; “You look for clarity around your role and the expectations of your role on a specific project or piece of work.”.
Here again we see a strong point towards detractors again with 64%. Our NPS this time comes out at -47.

The third question I asked in the survey was; “As a team, you disagree with the approach your manager is taking and propose an alternative approach.”.
The results here follow a similar trend, slightly more promoters in this question at 18%, but still a strong set of detractors at 63%. This time, our NPS score is -45.

The final question in the survey was; “You propose a new approach which is risky, but will prove successful for the team and company.”.
Again, another slight upward trend to 19% promoters, our NPS like the previous question is -45.

Headline summary
The headline summary of the initial data findings indicates across the board that most employees have a negative outlook based on the questions asked.
I found the results around having a personal situation that needed your attention scored low, this would be one situation that I thought would attract close to zero or a positive response. From experience, certainly in the UK, whenever I have presented a personal situation, I’ve always had a positive outcome.
I didn’t want to stop there though, I wonder how your region, job role, or your industry affects the results. This is a package for later that I’ll put together in a PDF, but I wanted to pull out some examples.
Looking at the technology sector
First of all, looking at respondents in technology, we had 152 people respond to the survey.

This produces a NPS of -51, with 66% of detractors, for the first question “You have had a personal situation and need to ask for a little time to sort it out so you can focus at work.”.
Next, I am restricting the dataset even further by looking just at Europe, to see if others experience is in line with mine. This produces 31 respondents.

This time, we do have more positive results, yes it is -26, but now we have 55% detractors and 29% promoters.
Finally, I wanted to compare this to North America, where I also have experience in working and hiring teams.
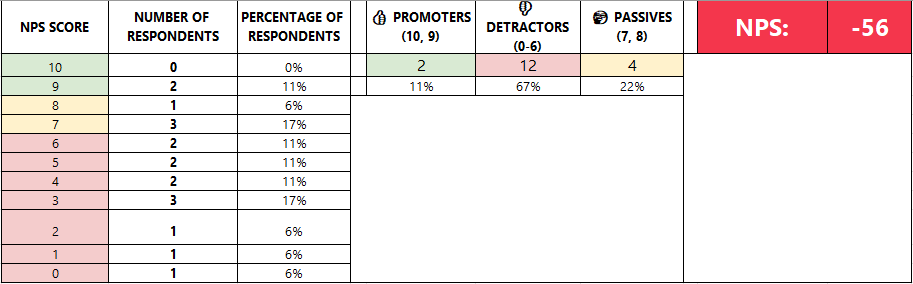
This time, we go back in line to our overall results, which show a NPS of -56 with 67% detractors.
Summary
The early stages of analysing this data show that generally speaking, there is little phycological safety across the business world, and within the IT industry, at least to the first question, the response is above the global average. In Europe this improves further, but in North America, this is in line with the global average.
Over the next few weeks, I want to spend more time getting more information out of the data, look for other patterns, highlights and lowlights. I will package this into a report style document, and post it up with a summary of the findings.
Thank you again everyone who took part, I look forward to presenting the final data!
